About our research
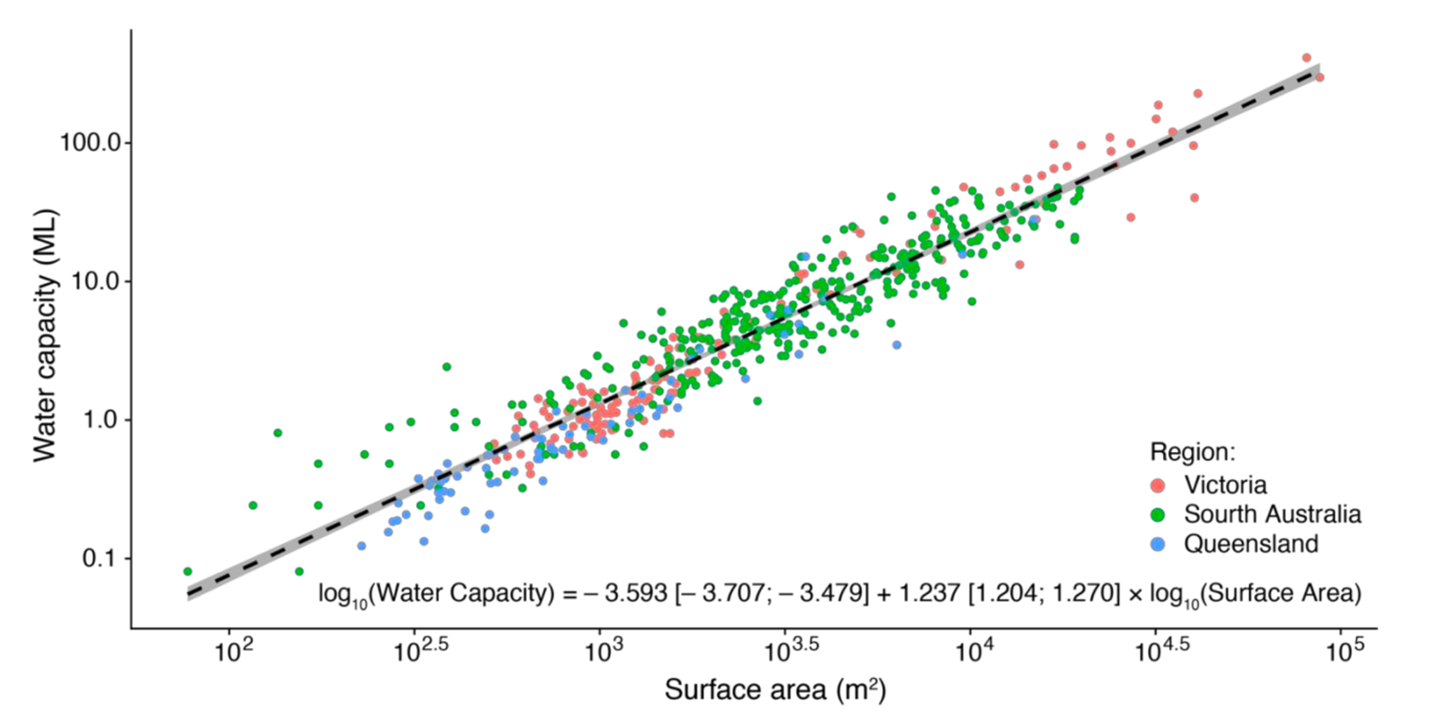
Figure 1: Relationship Between Farm Dam Surface Area and Water Capacity
This graph shows how you can estimate the water-holding capacity of a farm dam based on its surface area. Data from 558 farm dams across Victoria, South Australia, and Queensland indicate a strong relationship between the dam’s area and its total water capacity. These measurements were obtained using advanced mapping technologies (satellite imagery and laser scanning). Read more in Malerba et al. (2021, Remote Sensing).
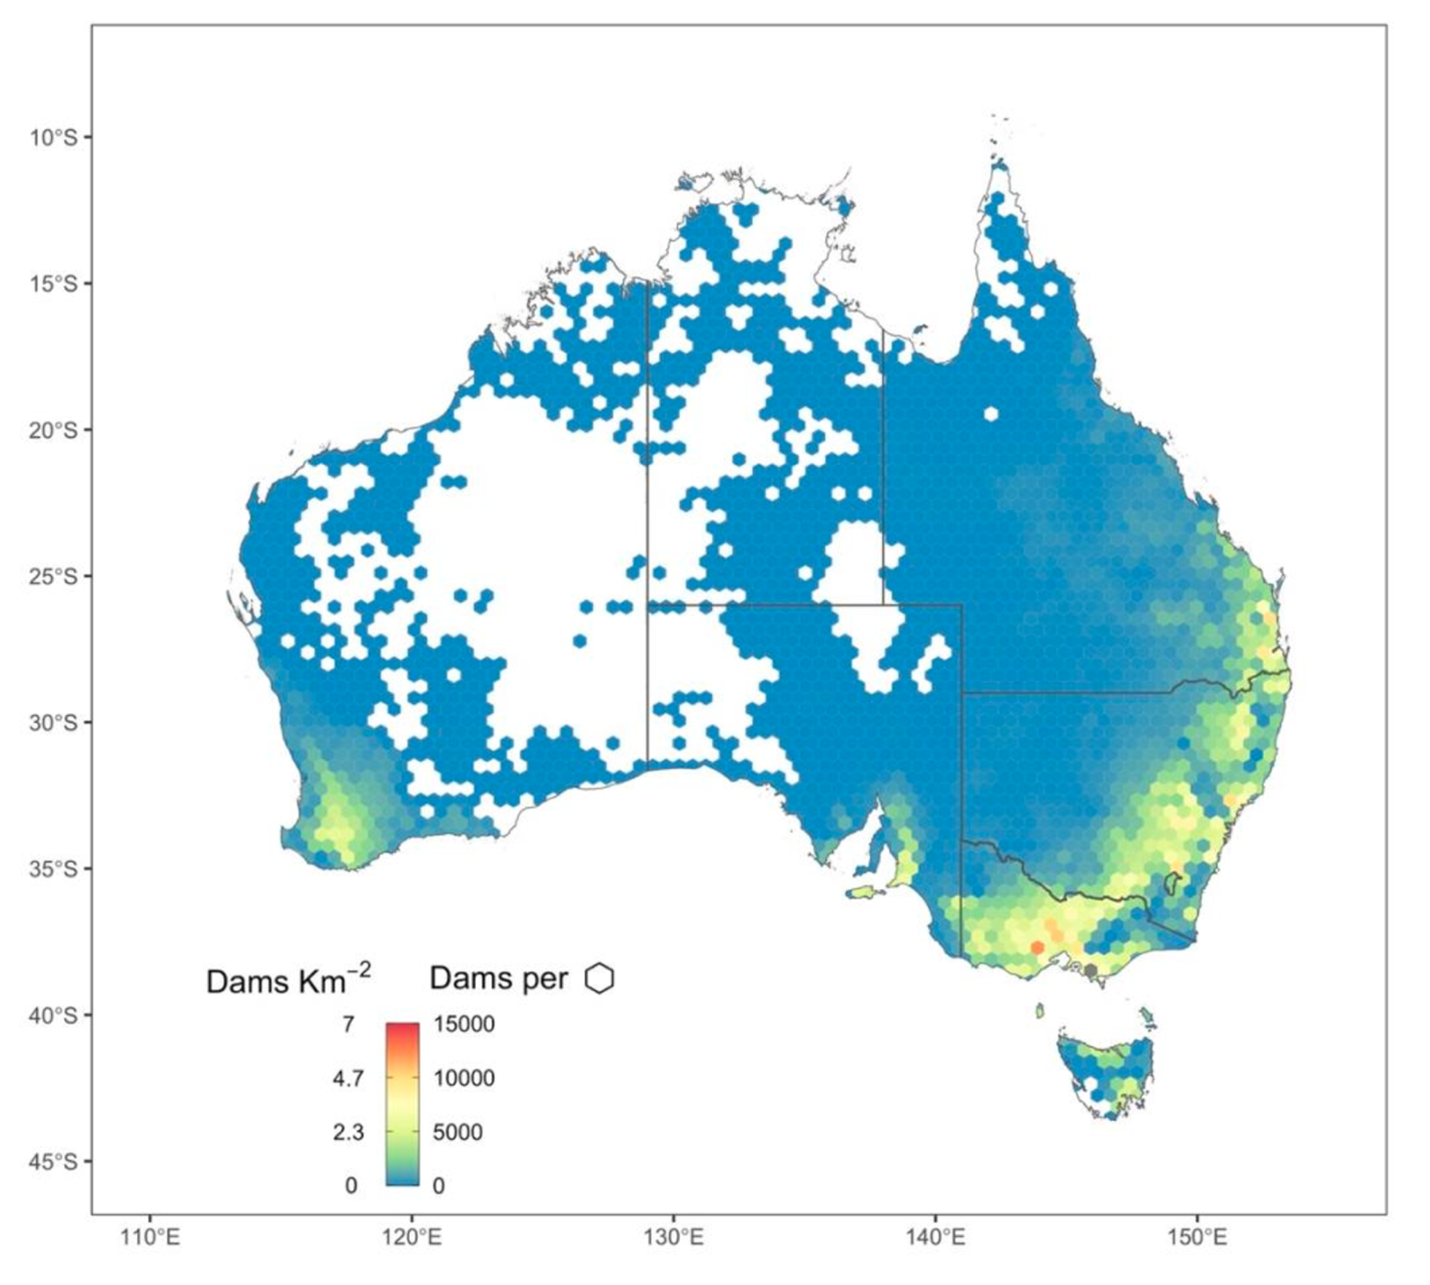
Figure 2: Distribution of Documented Farm Dams Across Australia
This map shows the density and total number of documented farm dams across Australian states and territories. Colours represent how many dams are found per square kilometre, with empty spaces indicating areas without recorded dams. Read more in Malerba et al. (2021, Remote Sensing).
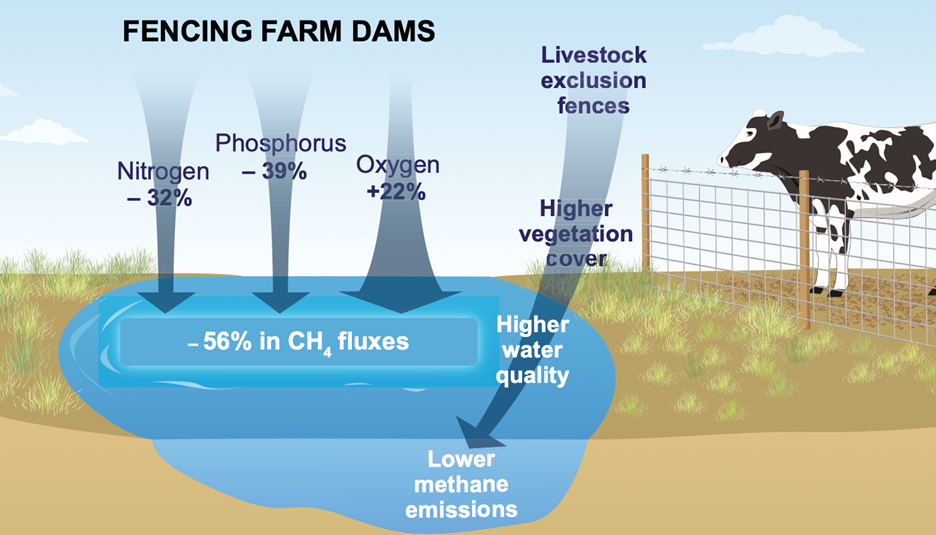
Figure 3: Benefits of Fencing Farm Dams for Water Quality and Greenhouse Gas Emissions
Installing fences around farm dams significantly improves water quality by preventing livestock from depositing manure directly into the water and reducing disturbance to the soil and vegetation. Compared to unfenced dams, fenced dams have fewer dissolved nutrients, higher levels of dissolved oxygen, and notably lower methane emissions. Read more in Malerba et al. (2022, Global Change Biology).
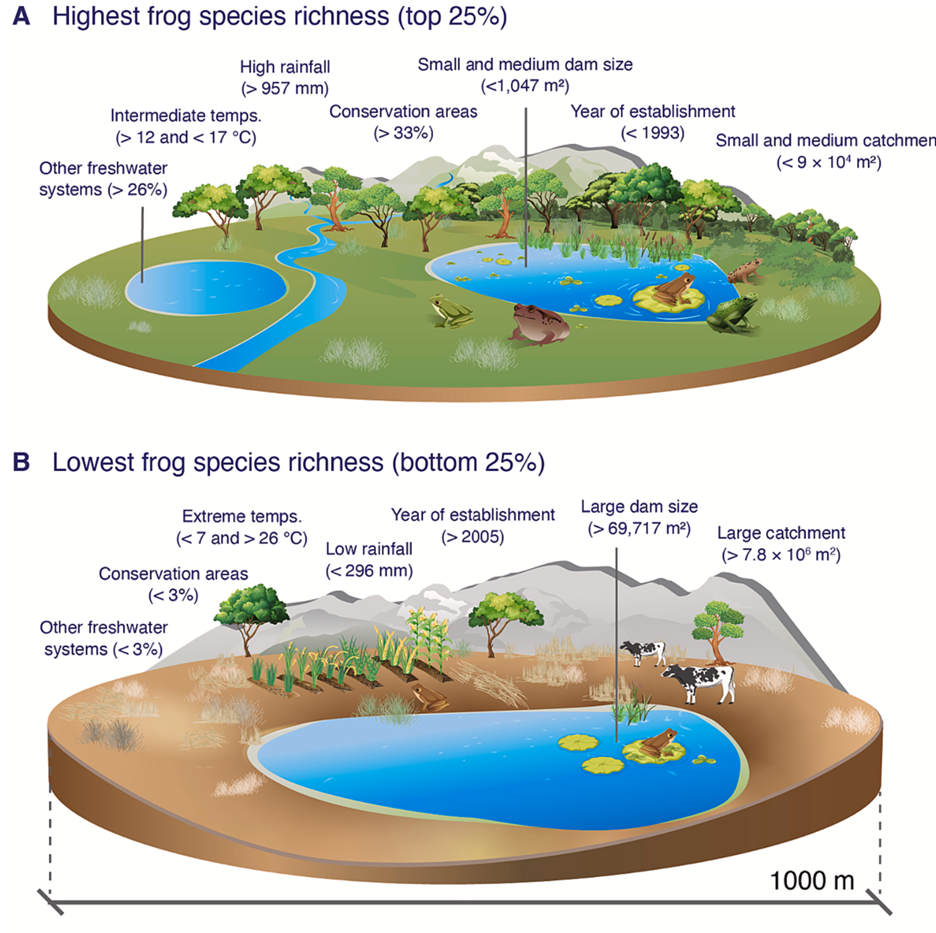
Figure 4: Farm Dam Features that Support Frog Biodiversity
This illustration summarises which characteristics of farm dams best support frog species richness. Older dams (over 20 years), medium-sized (around 0.1 hectares), with small rainfall catchments, located near other water bodies and conservation areas, and experiencing moderate temperatures and high rainfall provide the best habitats for frogs. Conversely, very large dams, isolated dams, and those in extreme climates support fewer frog species. Read more in Malerba et al. (2023, Biological Conservation).